Manurewa Intermediate School is a decile 1 multicultural school in South Auckland with approximately 800 students, including 50% Pasifika and 37% Māori.
This is our story of how we developed a Graduate Profile and then shaped an approach to enabling students and teachers to collaborate in making progress towards it visible, assessing that progress, and sharing it with parents, whānau, board and community.
This is just one way – there is no innovation without trial and error. We like to innovate. There are holes and things we already know we will change, things we neglected, room for improvement and things we should have acknowledged and included right at the start.
There is a robust dialogue emerging around "knowledge versus skills". Ours is a curriculum approach based on capabilities rather than knowledge acquisition.
We value ways we can report across whole communities. Dispositions and attitudes are very important to this. We still do, of course, provide information on the core of literacy and numeracy, but we want to increase the value and importance of our graduate qualities so that these are valued as much as the core ones.
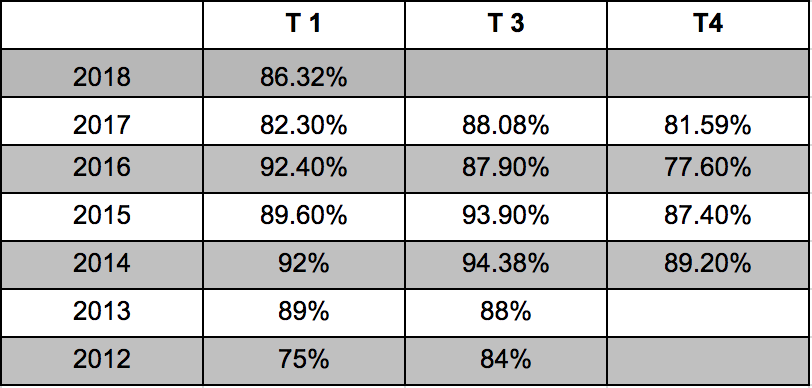
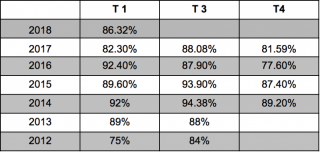
Our major process is through our Student Involved Conferences (SICs), but this is only successful if we can get whānau along to them. We monitor our success carefully as the table below shows and are reasonably happy with the levels of whānau engagement even if we seem to have plateaued over the last five years. We visit homes when we have no success with our invites and do our best to engage with every family.
Select the image to view at full size.
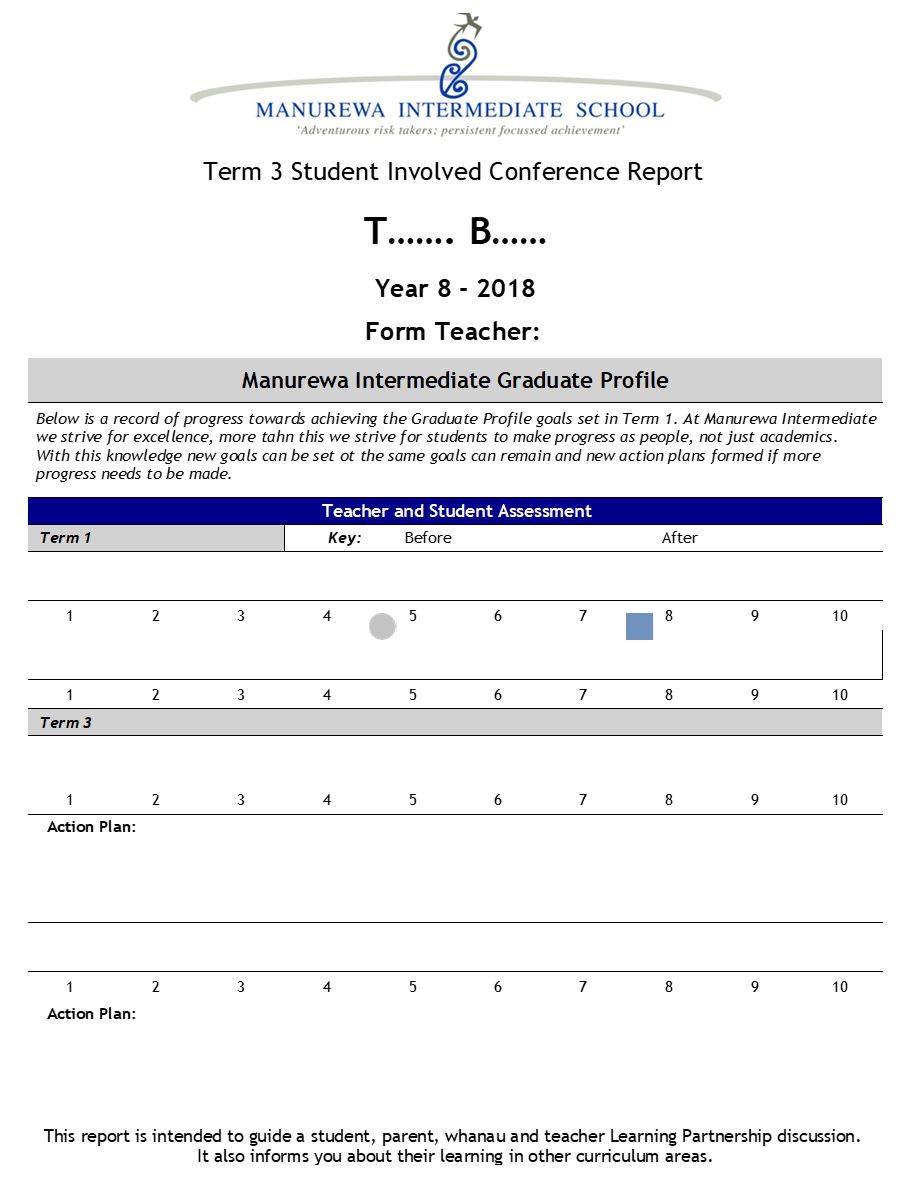
At the SICs, a goal is based on the qualities from the Graduate Profile, and the self-assessment by the student. Through discussion, an action plan of the next steps is decided and is typed up on the spot so that the student, teacher and parent are all clear about what happens next.
We also survey and interview both parents and students to ensure that we stay close to their thinking. We frequently invite parents for celebrations and put a strong emphasis on building relationships and building dispositions together.
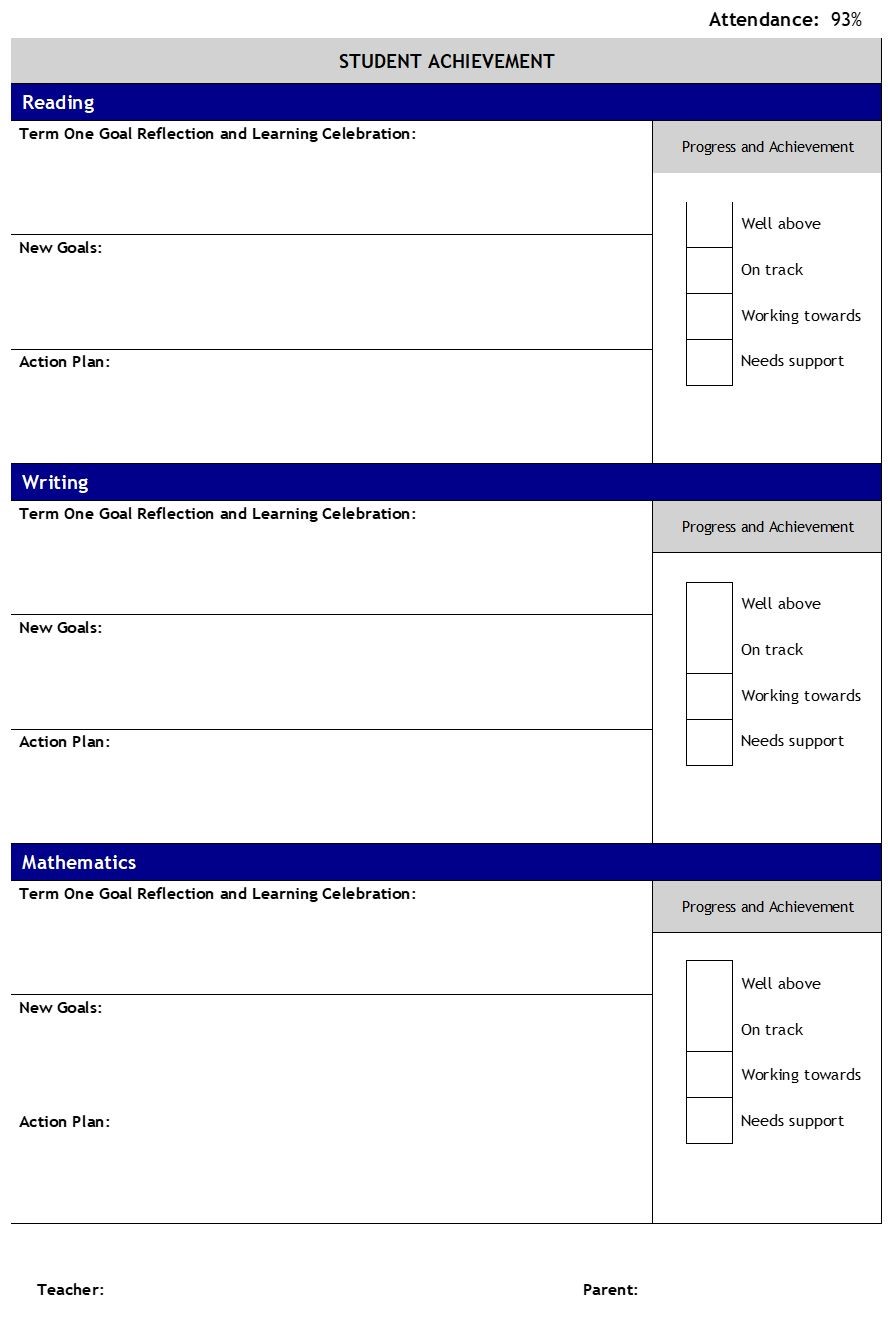
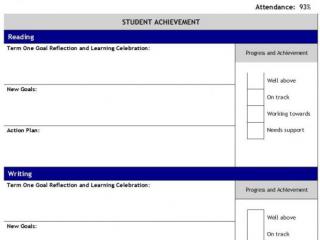
Student reports share information on progress on the Graduate Profile and the traditional areas of reading, writing and mathematics.
Select the image to view at full size.
Select the image to view at full size.
Sharing information with the Board and community
While the graduate profile is the pivot around which the teaching and learning revolves, the school does use a good range of standardised assessment tools for literacy and numeracy. These inform students as to where their learning is at, and to set goals. For the staff and Board, they enable reflection on changes over the year and assist in setting targets for the new year.
Extensive information about student achievement is shared with the Board. At the beginning of each year, a comprehensive analysis of all achievement data is carried out and it is all provided for the Board, along with commentary on the conclusions from the analysis for school resourcing and learning enhancement.
Cohort tracking: 2017, year 7 to 2018, year 8
| Stanine
| one
| two
| three
| four
| five
| six
| seven
| eight
| nine
|
| Term 1 2017
| 7
| 47
| 107
| 121
| 52
| 22
| 8
| 3
| 1
|
| Percentages
| 2
| 12.7
| 29
| 32.8
| 14
| 5.9
| 2
| 0.8
| 0.2
|
| Term 4 2017
| 64
| 72
| 85
| 76
| 35
| 24
| 7
| 3
| 1
|
| Percentages
| 17.4
| 19.6
| 23.1
| 20.7
| 9.5
| 6.5
| 1.9
| 0.8
| 0.2
|
| Term 1 2018
| 8
| 54
| 99
| 108
| 57
| 22
| 12
| 2
| 0
|
| Percentages
| 2.2
| 14.7
| 27.3
| 29.8
| 15.7
| 6
| 3.3
| 0.5
| 0
|
| Clean Cohort
| 5
| 45
| 84
| 92
| 51
| 19
| 9
| 2
| 0
|
| Percentages
| 1.6
| 14.6
| 27.3
| 29.9
| 16.6
| 6.1
| 2.9
| 0.6
| 0
|
*Note the difference in totals is due to the transient nature of a number of our students.
- While significant gains were noted in the year 8 students who had attended Manurewa Intermediate for the full two years 2017–2018, cohort tracking of current year 8's demonstrates the need to consolidate practices to ensure accelerated achievement for all students. The table above indicates the "two steps forward, one step backwards" nature of beginning and end of year PAT assessment.
- The number of students sitting at stanine 3-5 is an indication our students start with us approximately one year behind where they should be according to the PATC scale score table.
- It is important to consider this table from the percentage point of view because the total of students varies from term to term – the "clean cohort" eliminates all students who started after term 1, 2017.