You are here:
Information for educators who want to be able to load or download data onto a spreadsheet and use it for their own analysis.
You may want to go beyond the data reports from the digital assessment tools available, or from your student management system, or analyse data from assessments which produce only raw data.
The topics in the section have advice on manipulating data on a spreadsheet to prepare it for analysis. There are basic instructions on how to clean, sort and move data, and how to make and read simple graphs.
Working with data topics

Quantitative data in the form of scores can be entered into a spreadsheet in several ways. Data can be downloaded from a digital assessment tool or student management system.

It is important that data with which you are working to analyse results and draw conclusions is consistent, accurate and complete.
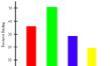
Graphs (also called charts) play an important role in data analysis. A graphic representation can make the relationship between sets of data much easier to understand.
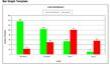
Disaggregating data means looking at achievement results or teacher judgments by specific subgroups of students. Disaggregated data can reveal patterns, trends and other important information.
Working with data concepts
Standards-based assessment relies on teachers making qualitative judgments about student’s learning.

The reliability of an assessment tool is the extent to which it consistently and accurately measures learning. The validity of an assessment tool is the extent by which it measures what it was designed to measure.
It is important to be aware of the types of data that are available so that the appropriate analytic techniques are used, and inappropriate ones are avoided.

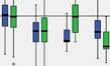
The mean and the median are both measures of central tendency. Standard deviation (SD) is a widely used measurement of variability used in statistics.
It is important to know the different ways different tools measure student achievement, and what that might mean for your analysis.
Norms are statistical representations of a population, for example PAT maths scores for year 6 males, or e-asTTle reading scores for year 9 Māori females.
Effect sizes allow us to compare things happening in different classes, schools or subjects regardless of how they are measured.
Return to top